
Debug Angular Performance Better with These Tools and Techniques
"What do you do when your Angular app is starting to slow down but you are not quite sure what's the cause? Here are some tools and techniques that may help you find the culprit that is slowing down your app!"
Angular's change detection mechanism was very fastinating when it first came out. Nevertheless, it can be very troublesome to debug, especially when your application get more complex.
I recently moved to a new project and was tasked with improving the performance of a particular page/feature in the app that is starting to get really slow.
This was quite a challenge as I have no knowledge about the application's architectures and designs prior to joining. The codebase has also been through many hands, some of which have already moved to another assignment or company.
After some investigating, I was able to find and optimize various codes that causes the degradation, and was able to achieve five to ten times improvement in cycle time for that particular feature.
What I am about to outlined in this post are the tools and techniques that has helped me scoped down the culprits that plague our app's performance.
Note: I am only going to talk about the tools I used to discover improvement areas. I won't go into the detail of the techniques and refactoring I did to actually fix the issues. That will get very long and will likely be another post of its own.
Chrome's Profiling Tools
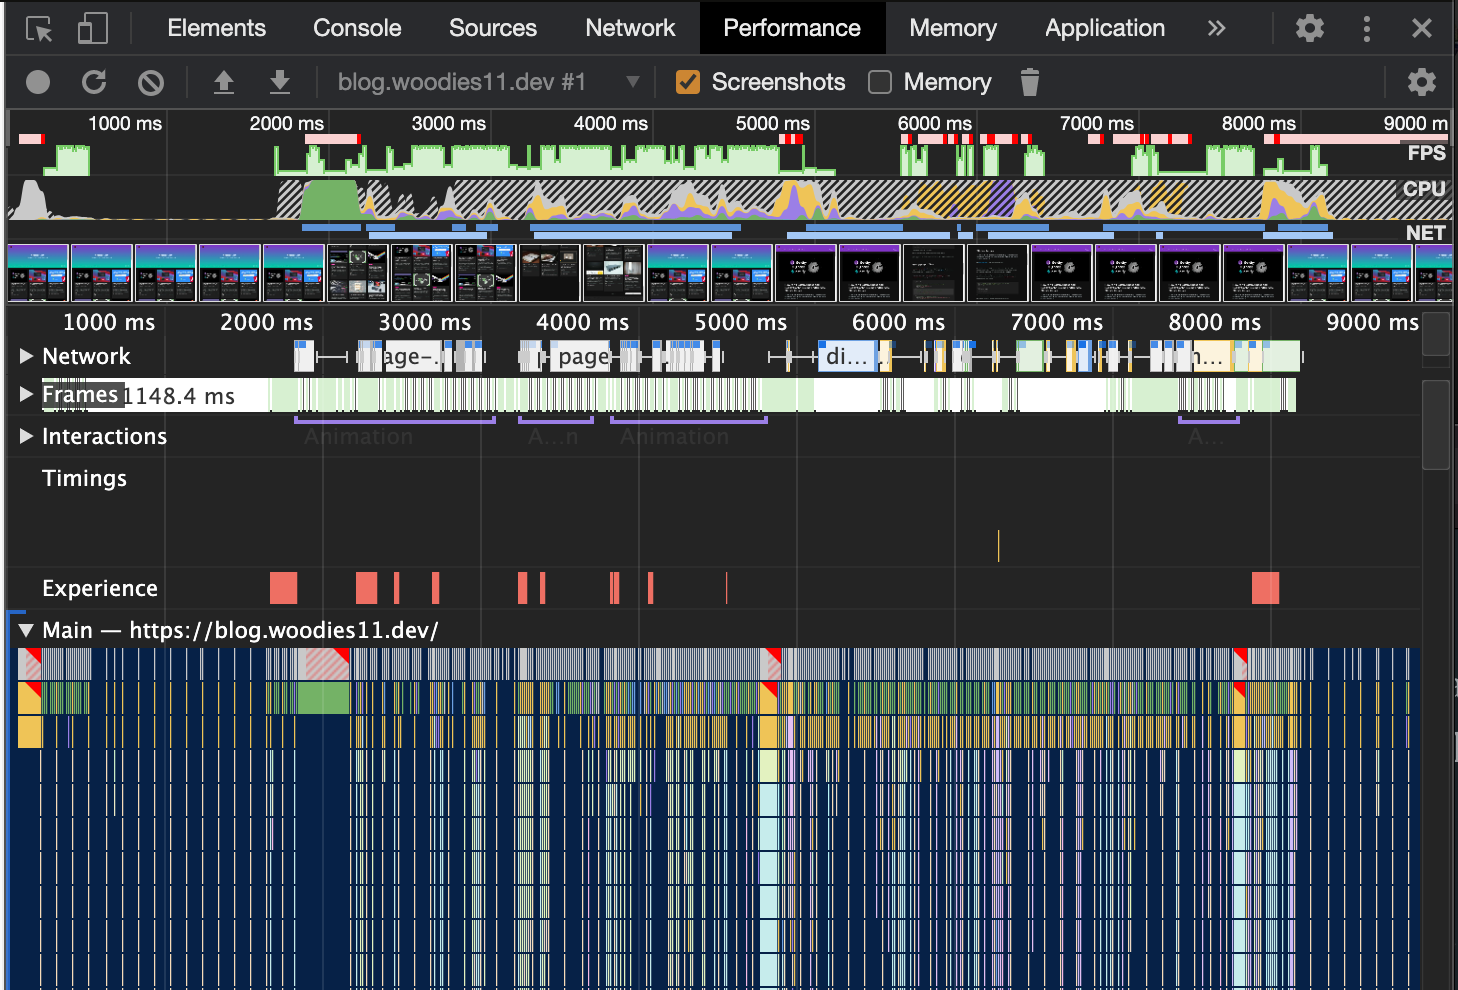
I will admit outright, I have no idea how to make sense of that Performance tab in Chrome. I know it can give me paint time and all, but I couldn't find a way to dig up what cause the slow down. The call stacks mostly trace back to Angular's own inner working like zone.js or core.js which are not very helpful.
Maybe I am missing something here but the profiling tool was not something I used a lot on this optimization journey.
Mornitoring Angular's Change Detection Time
The first thing I attempt to do was to get some quantifier matrices for how bad the performance currently is. A good starting point is to measure how long each change detection (CD) cycle took.
One way to do this is to patch the function call to trigger CD and have it log some time to the console. We will look into ng.profiler.timeChangeDetection() later on in the post. I don't want to call that function over and over though so the patching method is what I used.
In my AppModule, I first inject ApplicationRef in the constructor and patch the tick() function with some logging code:
export class AppModule {
constructor(applicationRef: ApplicationRef) {
if (isDevMode()) {
// First, store the original tick function
const originalTick = applicationRef.tick
applicationRef.tick = function () {
// Save start time
const windowsPerfomance = window.performance
const before = windowsPerfomance.now()
// Run the original tick() function
const returnValue = originalTick.apply(this, arguments)
// Save end time, calculate the delta, then log to console
const after = windowsPerfomance.now()
const runTime = after - before
window.console.log('[Profiler] CHANGE DETECTION TIME', runTime, 'ms')
return returnValue
}
}
}
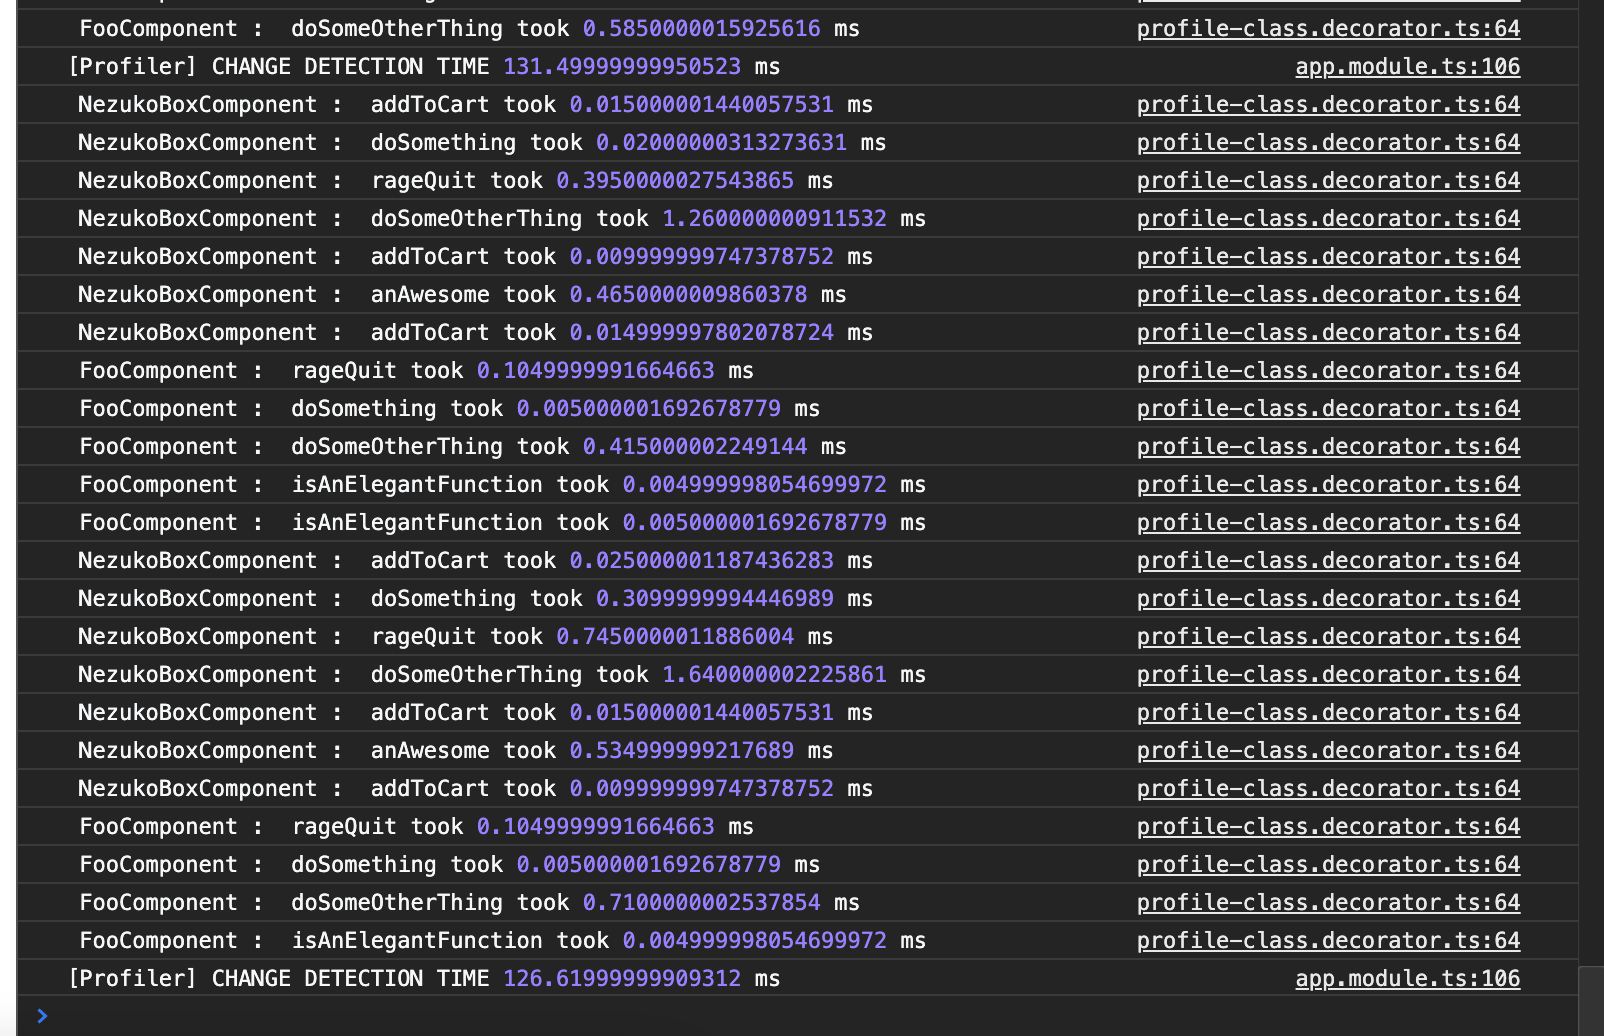
}Now, each time the CD run, we will see how long each cycle took printed out in the console.
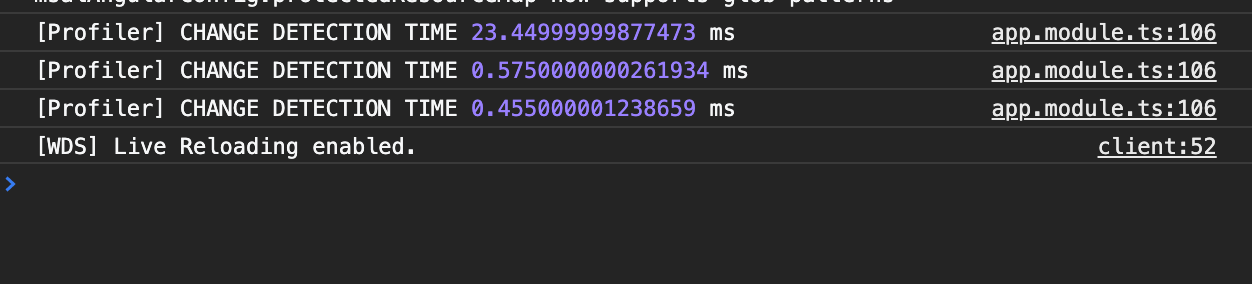
Keep in mind that the act of logging to console itself, as well as the various dev tools and processes that are attached by the inspector already cause the app to slow down quite a bit. Many tasks that are running on a machine at any particular time can also affect these number significantly. So, these should be used to compare relative performance improvement rather than as an absolute measure of an app's performance.
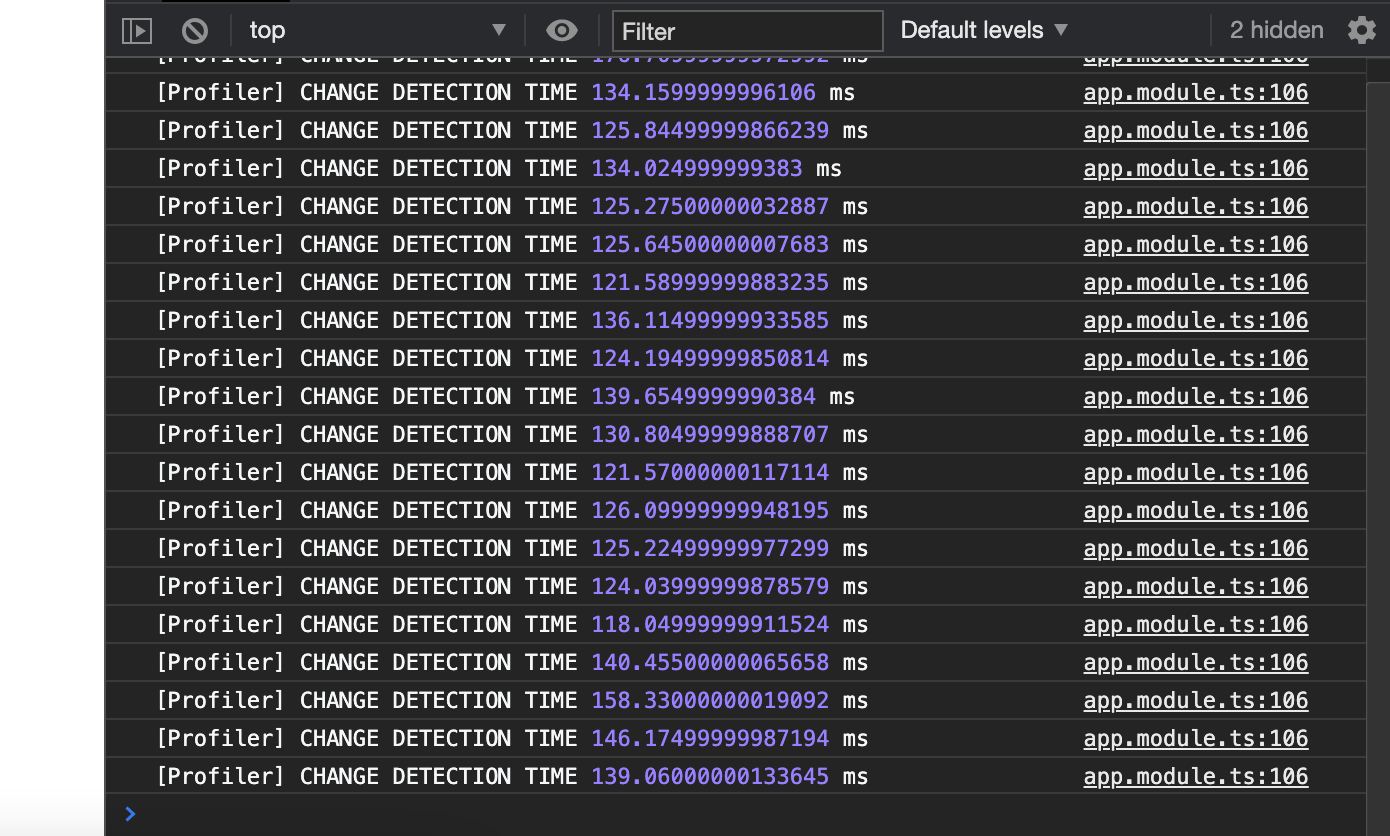
You can see our little app took around 120ms per cycle to run on my top-of-the-line 8-Cores Core i9 16" MacBook Pro with nothing else running on it. Not to mention it run 5 cycles of change detection per key input! That is around half a second of lag per keystroke. On a typical Core i7 or i5 machine, this can go up to ~250-500 ms per cycle. That made me want to rage comment on the site... except... my browser will freeze if I type too fast in there.
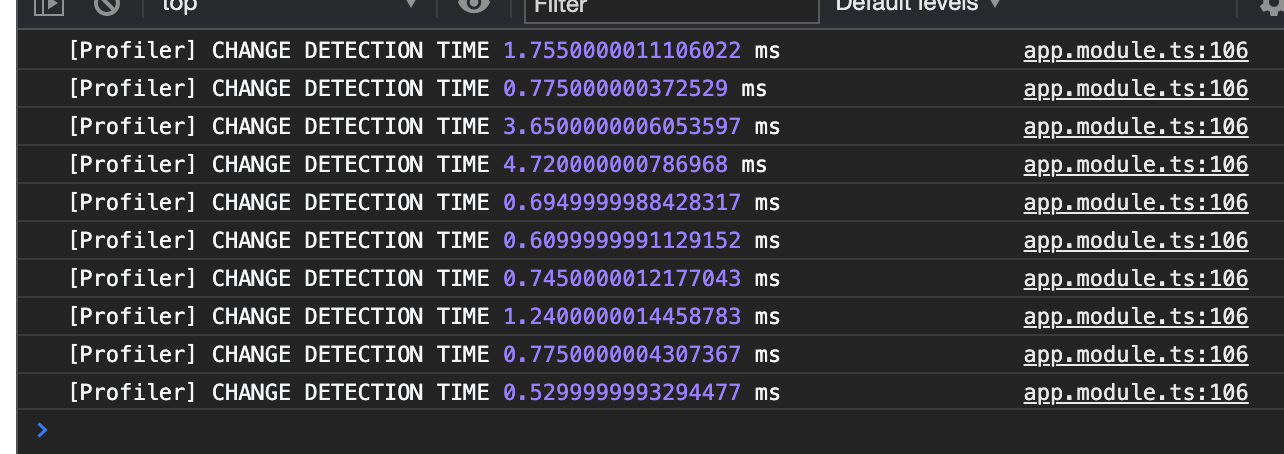
For comparison, most other pages take hardly a millisecond and only occationally go up to a few milliseconds at worst.
From my experience, apps that run at around 50ms per CD with the inspector open will drop to around 1~2ms with it closed. That is hardly noticable in most cases.
Helper Decorator
Now, I'll be honest, what you are about to see is rather dull 😂.
It is also the one of the less helpful tools I used, but it can flag some issues in certain scenarios so I will put it here anyway.
The second tool I used to investigate our performance issues is the good old console.log function. To get better understanding of who the functions wihtin the app interact with each other, and what function may potetially be causing the performance issues, I simply add console.log("FUNCTION NAME") to each the function in a component... EACH AND EVERY FUNCTIONS!
Well... I definitely did not do that manually though. That would be insane and go against my "proactively lazy" character that I want to take.
Instead, I wrote a simple @Decorator() that does that for me.
import { isDevMode } from '@angular/core'

/**
 * Use to patch all functions/methods in a class and make them print out run time
 * in ms to the console.
 *
 * This decorator will only patch functions declared in the target class.
 * It will **not** patch functions reside in the **base class**.
 * Dynamically created functions or functions received from the outside as input
 * may also not be patched.
 *
 * Keep in mind that the act of printing stuffs to the console itself will slow down
 * some function a little. This could add up if that function is called multiple times in a loop.
 * Callbacks may also not be tracked so functions that rely on
 * callbacks to do heavy lifting may appear to take very little time
 * here.
 *
 * @param threshold allow filtering log to only those that took more than the threshold (in ms)
 */
export function ProfileClassToConsole({ prefix = '', threshold = 0 } = {}) {

    return function (target: Function) {

        // Guard to skip patching
        if (!isDevMode()) {
            return
        }

        // Loop through all property of the class
        for (const propName of Object.keys(target.prototype)) {

            const descriptor = Object.getOwnPropertyDescriptor(target.prototype, propName)

            // If not a function, skip
            if (!(descriptor.value instanceof Function)) {
                continue
            }

            const windowsPerfomance = window.performance
            const fn = descriptor.value

            descriptor.value = function (...args: any[]): any {

                const before = windowsPerfomance.now()

                const result = fn.apply(this, args)

                const after = windowsPerfomance.now()
                const runTime = after - before
                if (runTime > threshold) {
                    console.log(prefix, target.name, ': ', propName, 'took', runTime, 'ms')
                }

                return result

            }

            Object.defineProperty(target.prototype, propName, descriptor)

        }
    }
}
I also made a similar one for sole function. It is very similar to above code so you can like adapt it for individual funtion yourself.
Now I can use the decorator like this:
@ProfileClassToConsole()@Component({
	// ...
})
export class MyComponent {
	// ...
}
I logged the time here as well just in case. However, you should take these time even more with a grain of salt than the CD time itself. Many things will escape this logging method. The main one being callbacks such as those called by observables. Just because a function finish calling and returning doesn't mean the side-effect it triggered has finished. You also need to put this decorator on a lot of components if you want to get anywhere near complete CD time.
Instead, this is useful for inspecting how your functions interact with each other and which events trigger which functions to run.
One of the beginner mistake, for example, is calling long running function in the HTML. These functions will be called every single time a change detection run. We had a page in the app that has these pattern in an *ngFor block that result in a few functions being run 30 times a cycle. These will become very obvious when using this decorator.
Angular Debug Tools
Probably the most powerful tool on this list is Angular's own Debug Tools.
A quick note, these tools seems to differ quite a bit from version to version. At the time I worked on these optimization, we were on Angular version 7. The exact code may differ if you are on different version.
To enable these tools, you need to add a few line of code in your src/main.ts.
import { ApplicationRef, isDevMode } from '@angular/core'
import { enableDebugTools } from '@angular/platform-browser'
import { platformBrowserDynamic } from '@angular/platform-browser-dynamic'

import { AppModule } from './app/app.module'

// ... other bootstrap code

platformBrowserDynamic()
    .bootstrapModule(AppModule)
    .then(moduleRef => {

        if (isDevMode()) {
            // Enable console debug tools
            const appRef = moduleRef.injector.get(ApplicationRef)
            const componentRef = appRef.components[0]

            enableDebugTools(componentRef)
        }
    })
    .catch(err => console.error(err))
ng.profiler.timeChangeDetection()
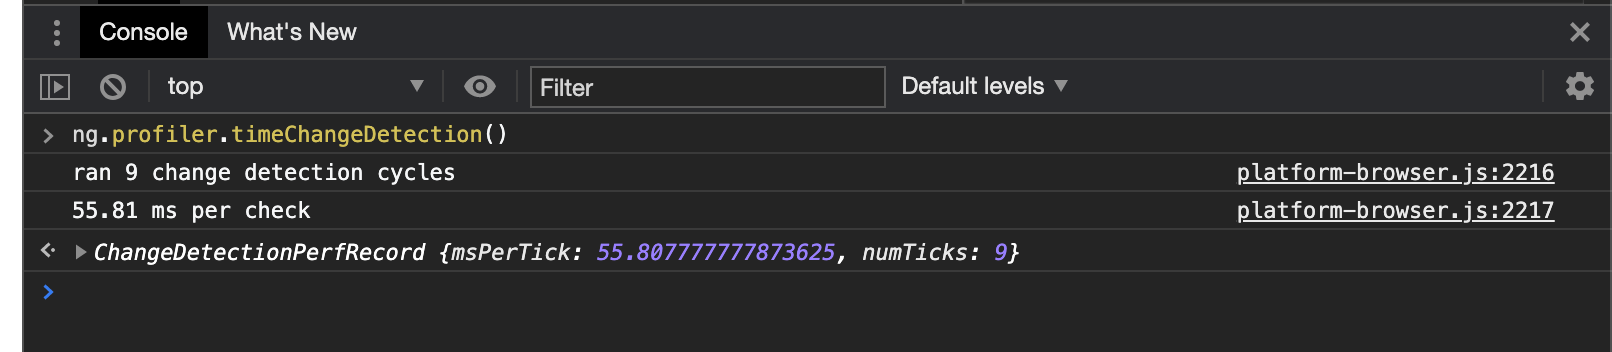
One of the tool enabled is ng.profiler.timeChangeDetection(). This funtion basically run the app's root CD a few time and print out average time required.
In your browser's (I'm using Chrome here) Dev Console, type ng.profiler.timeChangeDetection():
Combining this with the patch we did to tick() function in the first step result in this:
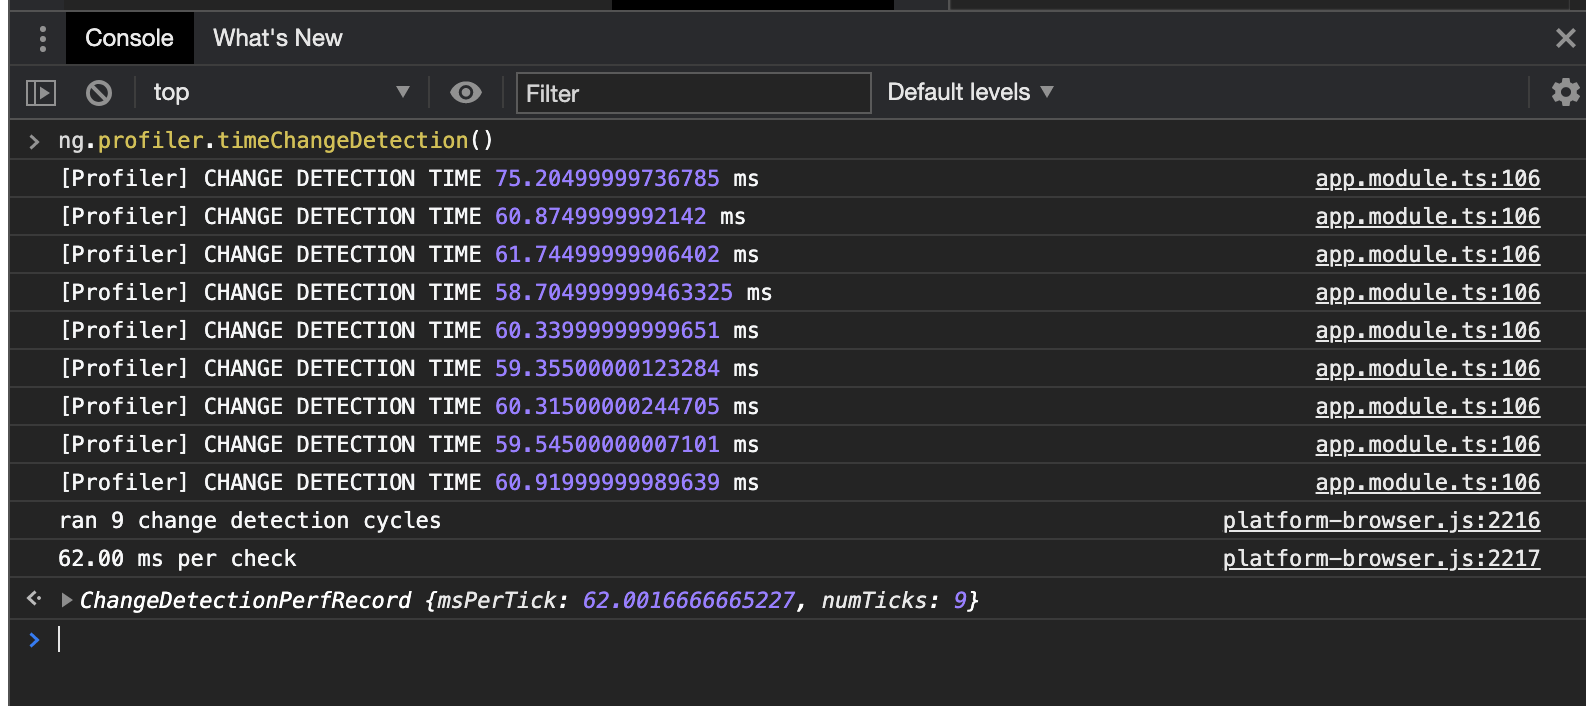
As you can see, I don't normally use this function too much as my patch already give me CD time.
ng.probe() or ng.getComponent()
This, here, is the real deal! Angular dev tool provide us with a function that allwo us to tap into a component's state and infomation at runtime, as well as altering some of its state.
Again, we were on Angular 7 when I worked on these so ng.probe().componentInstance is what I used. If you are on version 9 and above with Ivy compiler, the function has changed to ng.getComponent().
In Chrome—and like most modern browsers, I know Safari work similarly—if you select something in the inspector, you may notice it says == $0 at the end.
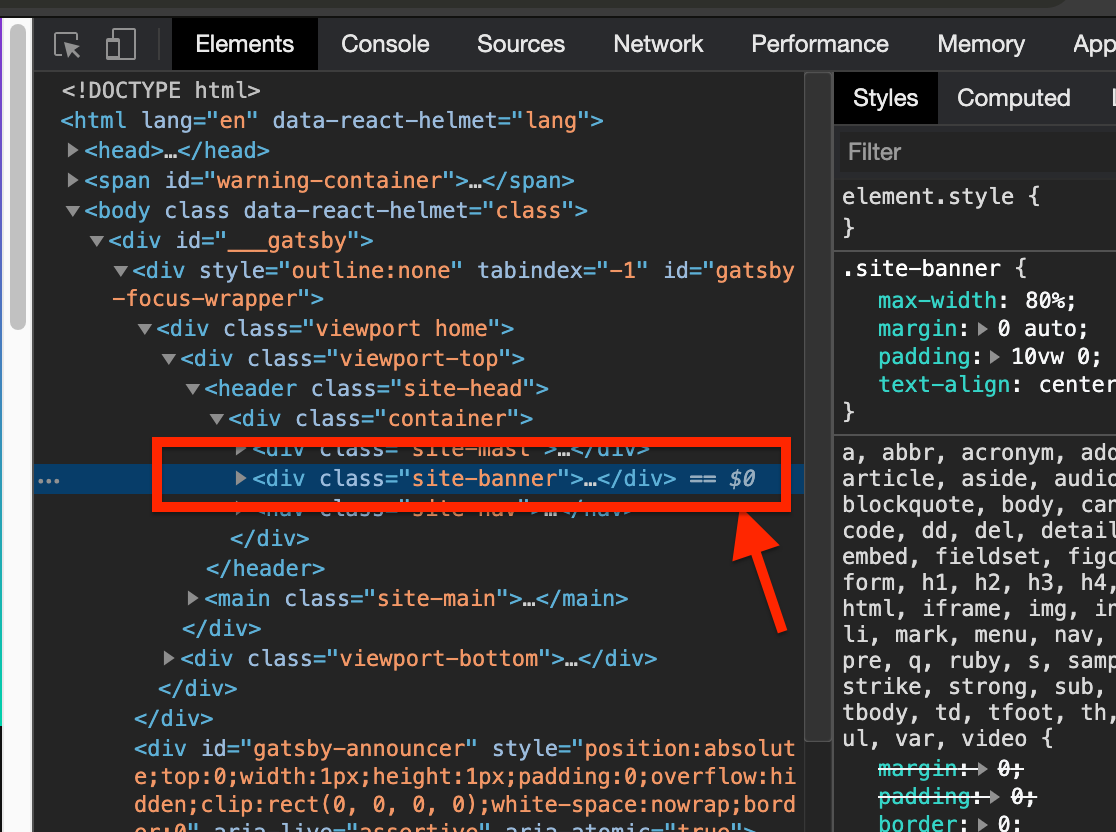
The inspector will in fact automatically store whatever you select in this speciall $0 variable. There are also $1 that store the previously selected element, $2 that store another element back, and so on. We will only use $0 99% of the time though.
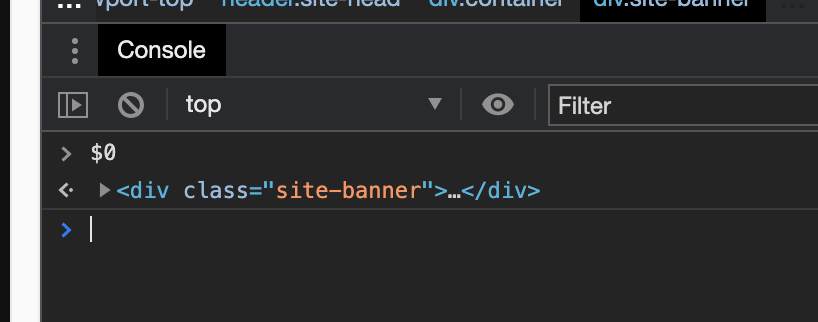
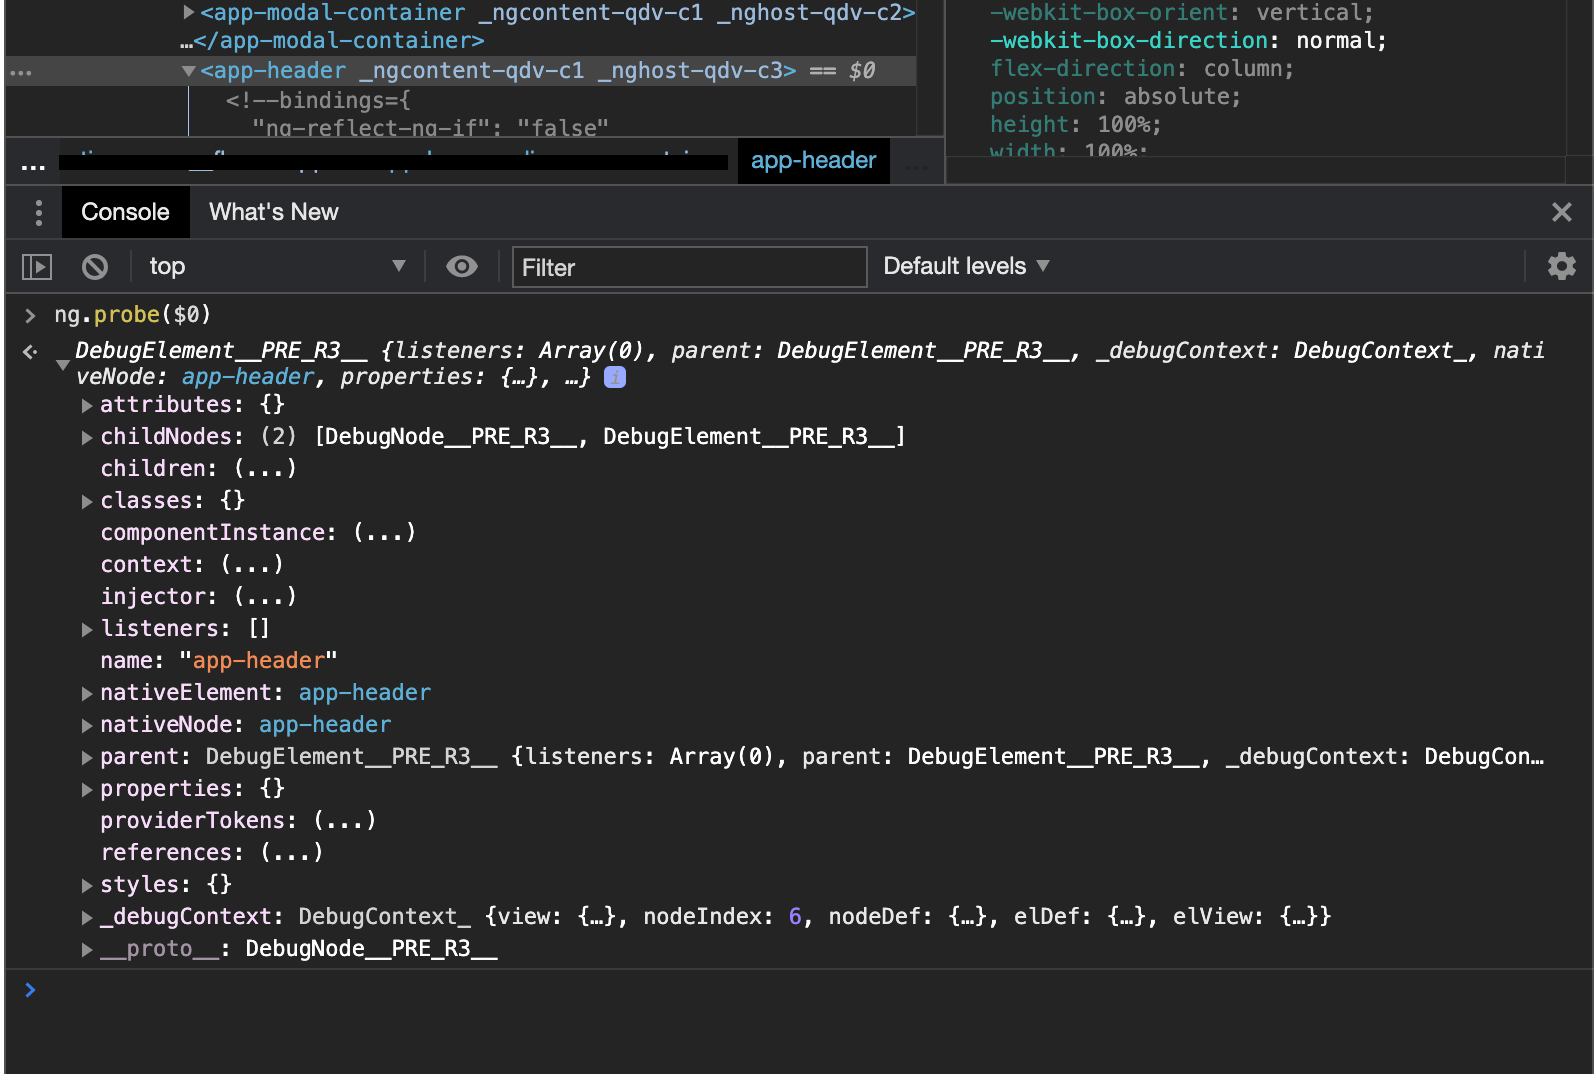
If you use the inspector to select any Angular Component (e.g. <app-some-component> tag) and pass it to ng.probe(), it will return something interesting:
Note, with ng.probe(), you can actually select any of the component's child node, as long as that node is not an Angular Component itself, and ng.probe() will find the right Angular Component. With ng.getComponent() however, you will need to select the Angular Component's selector tag itself.
componentInstance
Now, this DebugElement object here has a bunch of useful things. The one we are going to focus on right now is its componentInstance.
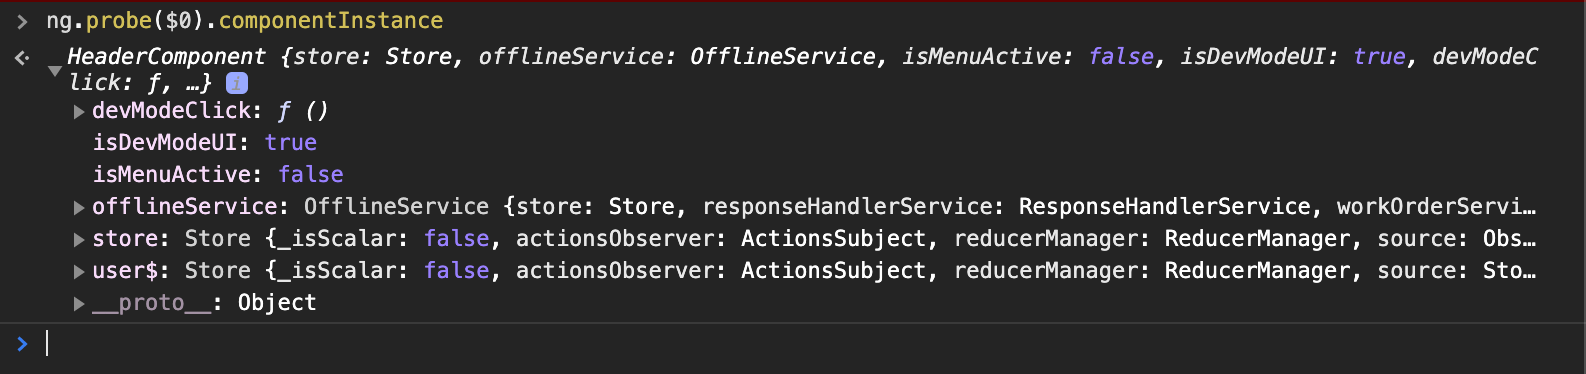
As you may guess, this object give us access to the current component instance and all of its current state. This is like putting a breakpoint in your component and inspect its state, but one you can tap into anytime. No more "oh! I missed that breakpoint!!!".
Not only does this give you access to its state, but it also give you the ability to make change and run any function within the instance.
For example, I can do:
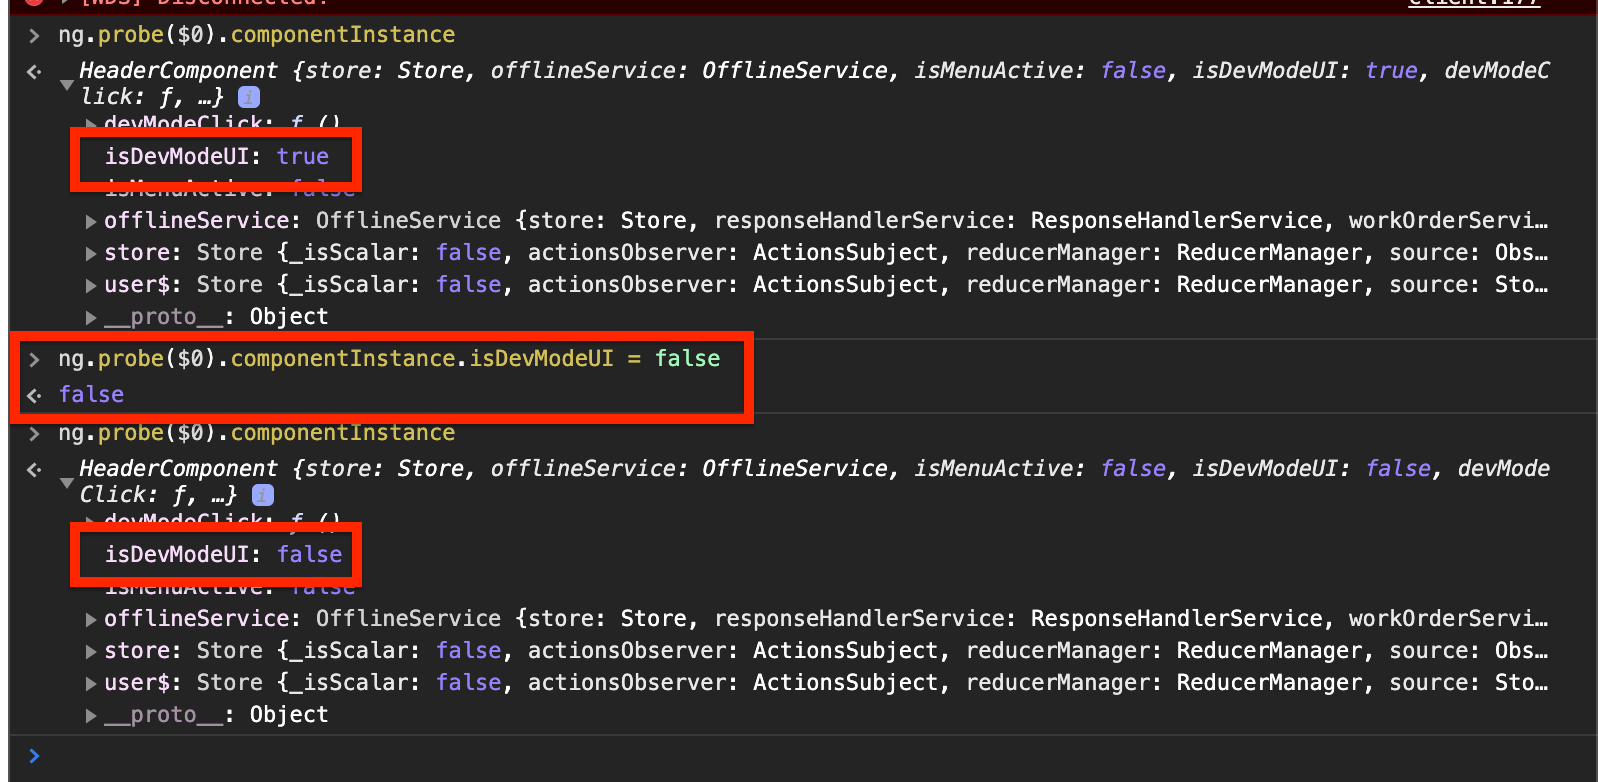
This change may not reflect on the app right away because changing a component's state this way does not trigger automatic change detection. However, if you do anything that trigger change detection (such as running ng.profiler.timeChangeDetection() or just click some stuffs on your app), you will see the change being reflected right away!

Nevertheless, if that particular property is decorated with @Input(), it may get replaced with the old value from the @Input() during CD so you may never see any change happening, unfortunately.
You can also execute a method within the instance:
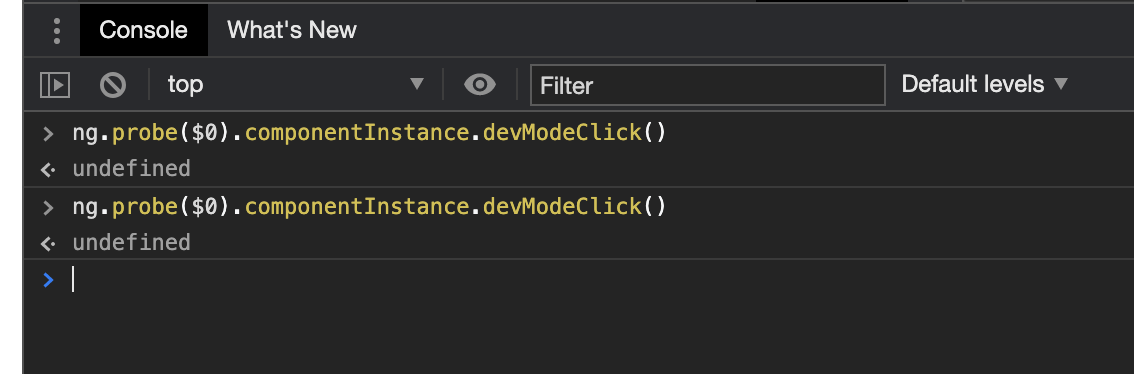
This method doesn't return anything but you get the point.
Injecting ChangeDetectorRef
To get the most out of ng.probe() for performance debugging, you can inject ChangeDetectorRef into your component like this:
export class MyComponent {
	// ...
    constructor(
        public cdRef: ChangeDetectorRef
    ) { /* ... */ }
}
This will allow us to access the component's change detector at runtime.
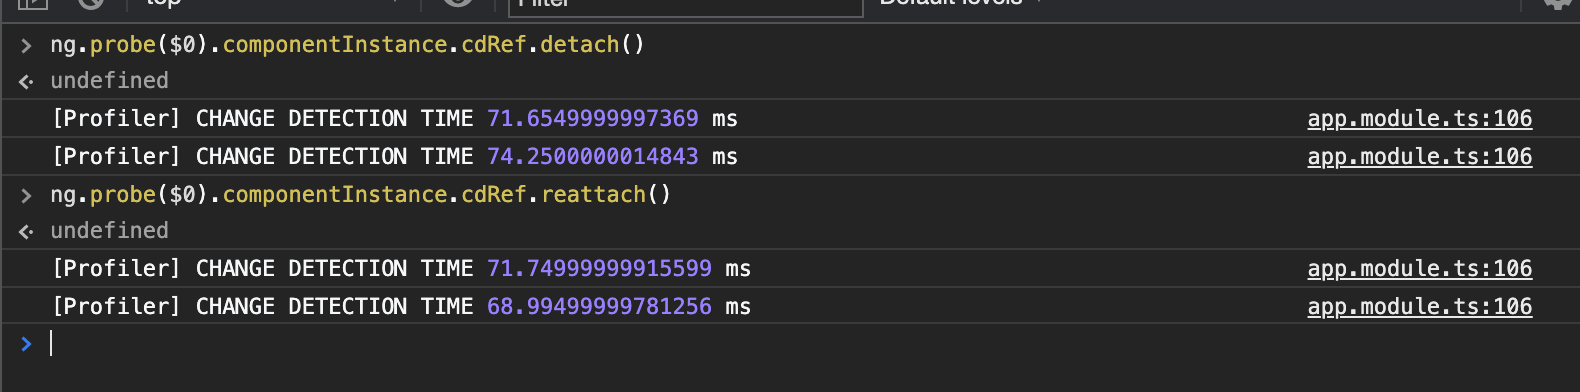
You can use detach() and reattach() to manually turn CD off and on for a particular component, enabling you to somewhat isolate the effect of a component's change detection cycle on overall app's performance.
For example, if detaching a component's CD reduce the overall CD time by 50ms then you can say that the component or some of its children is costing around 50ms of time to complete its CD.
I also wrote a snippet that you can paste into the console:
const cd = () => {
    const wp = window.performance
    const before = wp.now()
    ng.probe($0).componentInstance.cdRef.detectChanges()
    const after = wp.now()
    const runTime = after - before
    console.log('CD Took', runTime)
}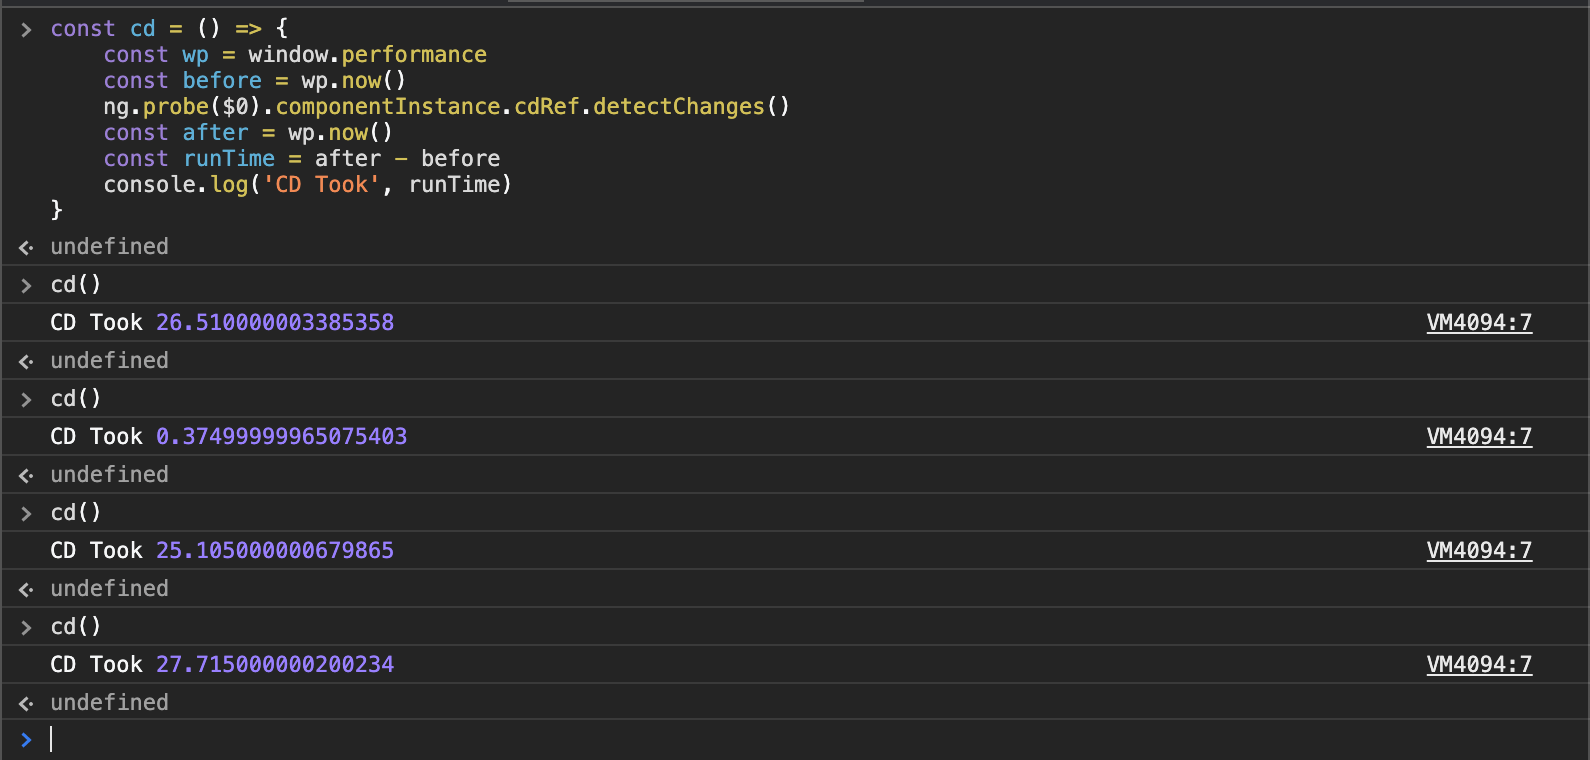
This will allow you to type cd() into in console and it will print out how long that component's CD cycle took to run.
Again, you will need to change the function to ng.getComponent() if you are using Ivy. That snippet also expect the component to have a ChangeDetectorRef named cdRef expose for it to use. There might be a better way to trigger component level CD in other version of Angular but I couldn't seem to find it for version 7.
Conclusion
With all those tools under your belt, it's a matter of going through each of the suspected component and try to isolate their CD performance to lock down on area of improvement. As for how to actually optimize the CD time of a component once you found what is causing the slow down... that will be long enough to be a post of its own so stay tune for when that drop!
As you can see, the method I used is rather... hacky I would say. I'm sure there are better ways to go about this. If you know of a more elegant solution, please feel free to enlight me by dropping that in the comment or reach out via any of the contact channels provided. Thanks!
